

RAMAN SPECTROSCOPY: FROM APPLICATIONS TO LASER SOURCES AND DETECTORS
Section n. 1
Prospects of stimulated Raman scattering in pharma research
Written by Jan Majer (ESR13)
Before a novel medicine can be introduced on the market, it needs to undergo a drug development process which today on average consists of six stages – drug discovery, pre-clinical testing, phase I, phase II and phase III clinical testing and finally drug licensing. The drug development process from target discovery to the launch can take up to 15 years [1]. Moreover, the vast majority of pharmaceutical candidates fail in the pipeline causing so called “attrition”. The pressure of attrition drives scientists to discontinue research of candidates in very early stages of drug development during pre-clinical studies. Indeed, high attrition rates are steadily decreasing in all clinical stages over the recent years [2]. The application of coherent Raman scattering (CRS) has been one of many drivers behind the attrition rate decrease and continues to take up role in various pharmaceutical pipeline stages. CRS has drawn substantial attention since the beginning of the millennium spanning over plethora of biologically relevant applications including pharmaceutical tablet mapping, histology, drug delivery, ion transport and lipid disease studies.
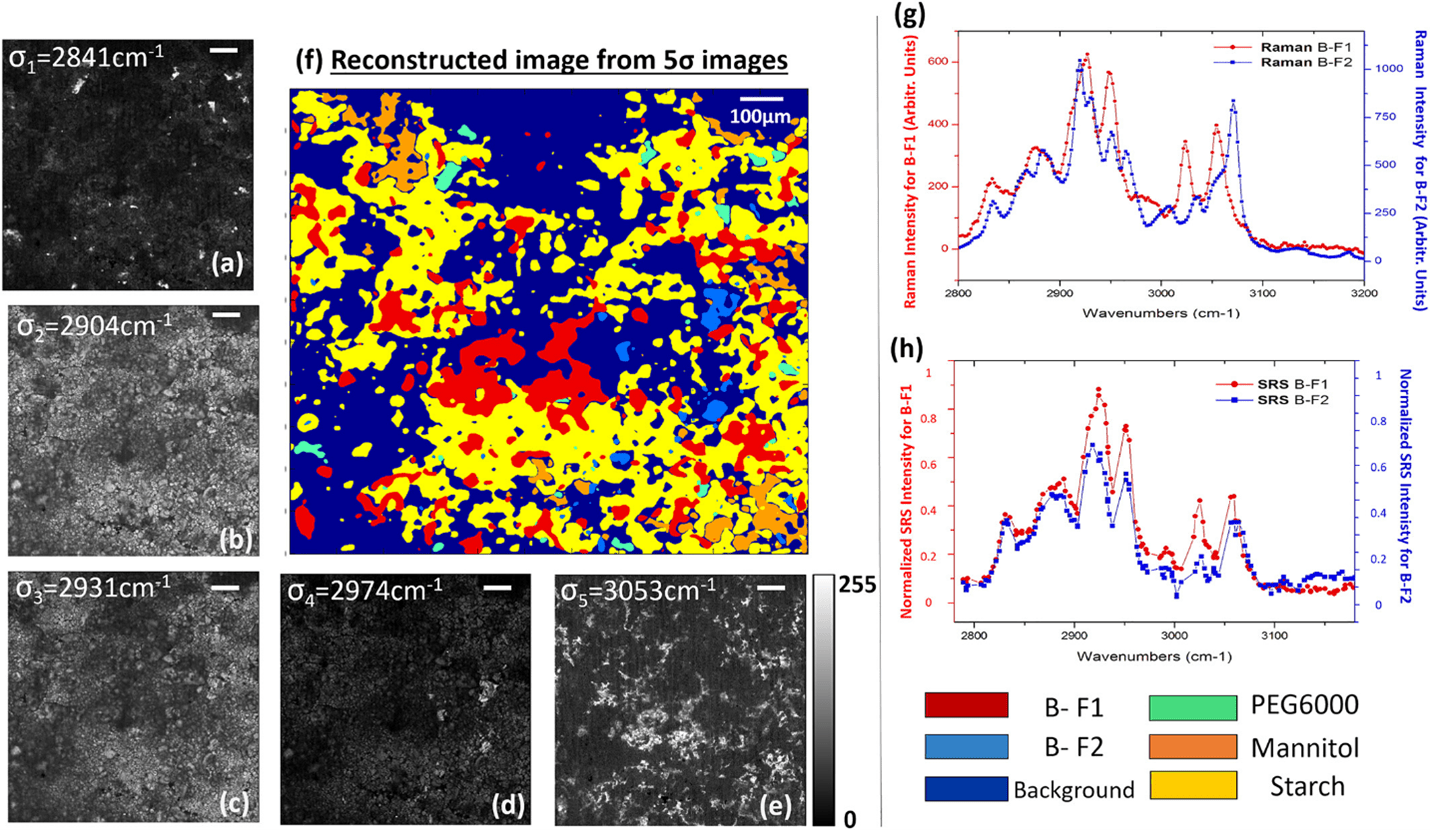
Tablet formulation of a drug is commonly associated with Raman in pharmaceutical research. Drug tablets generally consist of an active pharmaceutical ingredient (API) – the active drug substance itself – and also “excipients” (e.g. polyethylene glycol, corn starch, and mannitol etc.) which stabilize and support the API. CRS has been widely implemented in understanding the crystallisation polymorphism which is known to impact solubility and bioavailability of an API. In Raman spectra, polymorphism can manifest in spectral shifts on a scale of tens of wavenumbers. Such shifts are distinctive enough in stimulated Raman scattering (SRS) -generated spectra to allow highly precise analysis of drug tablets as shown in figure 1 [3].
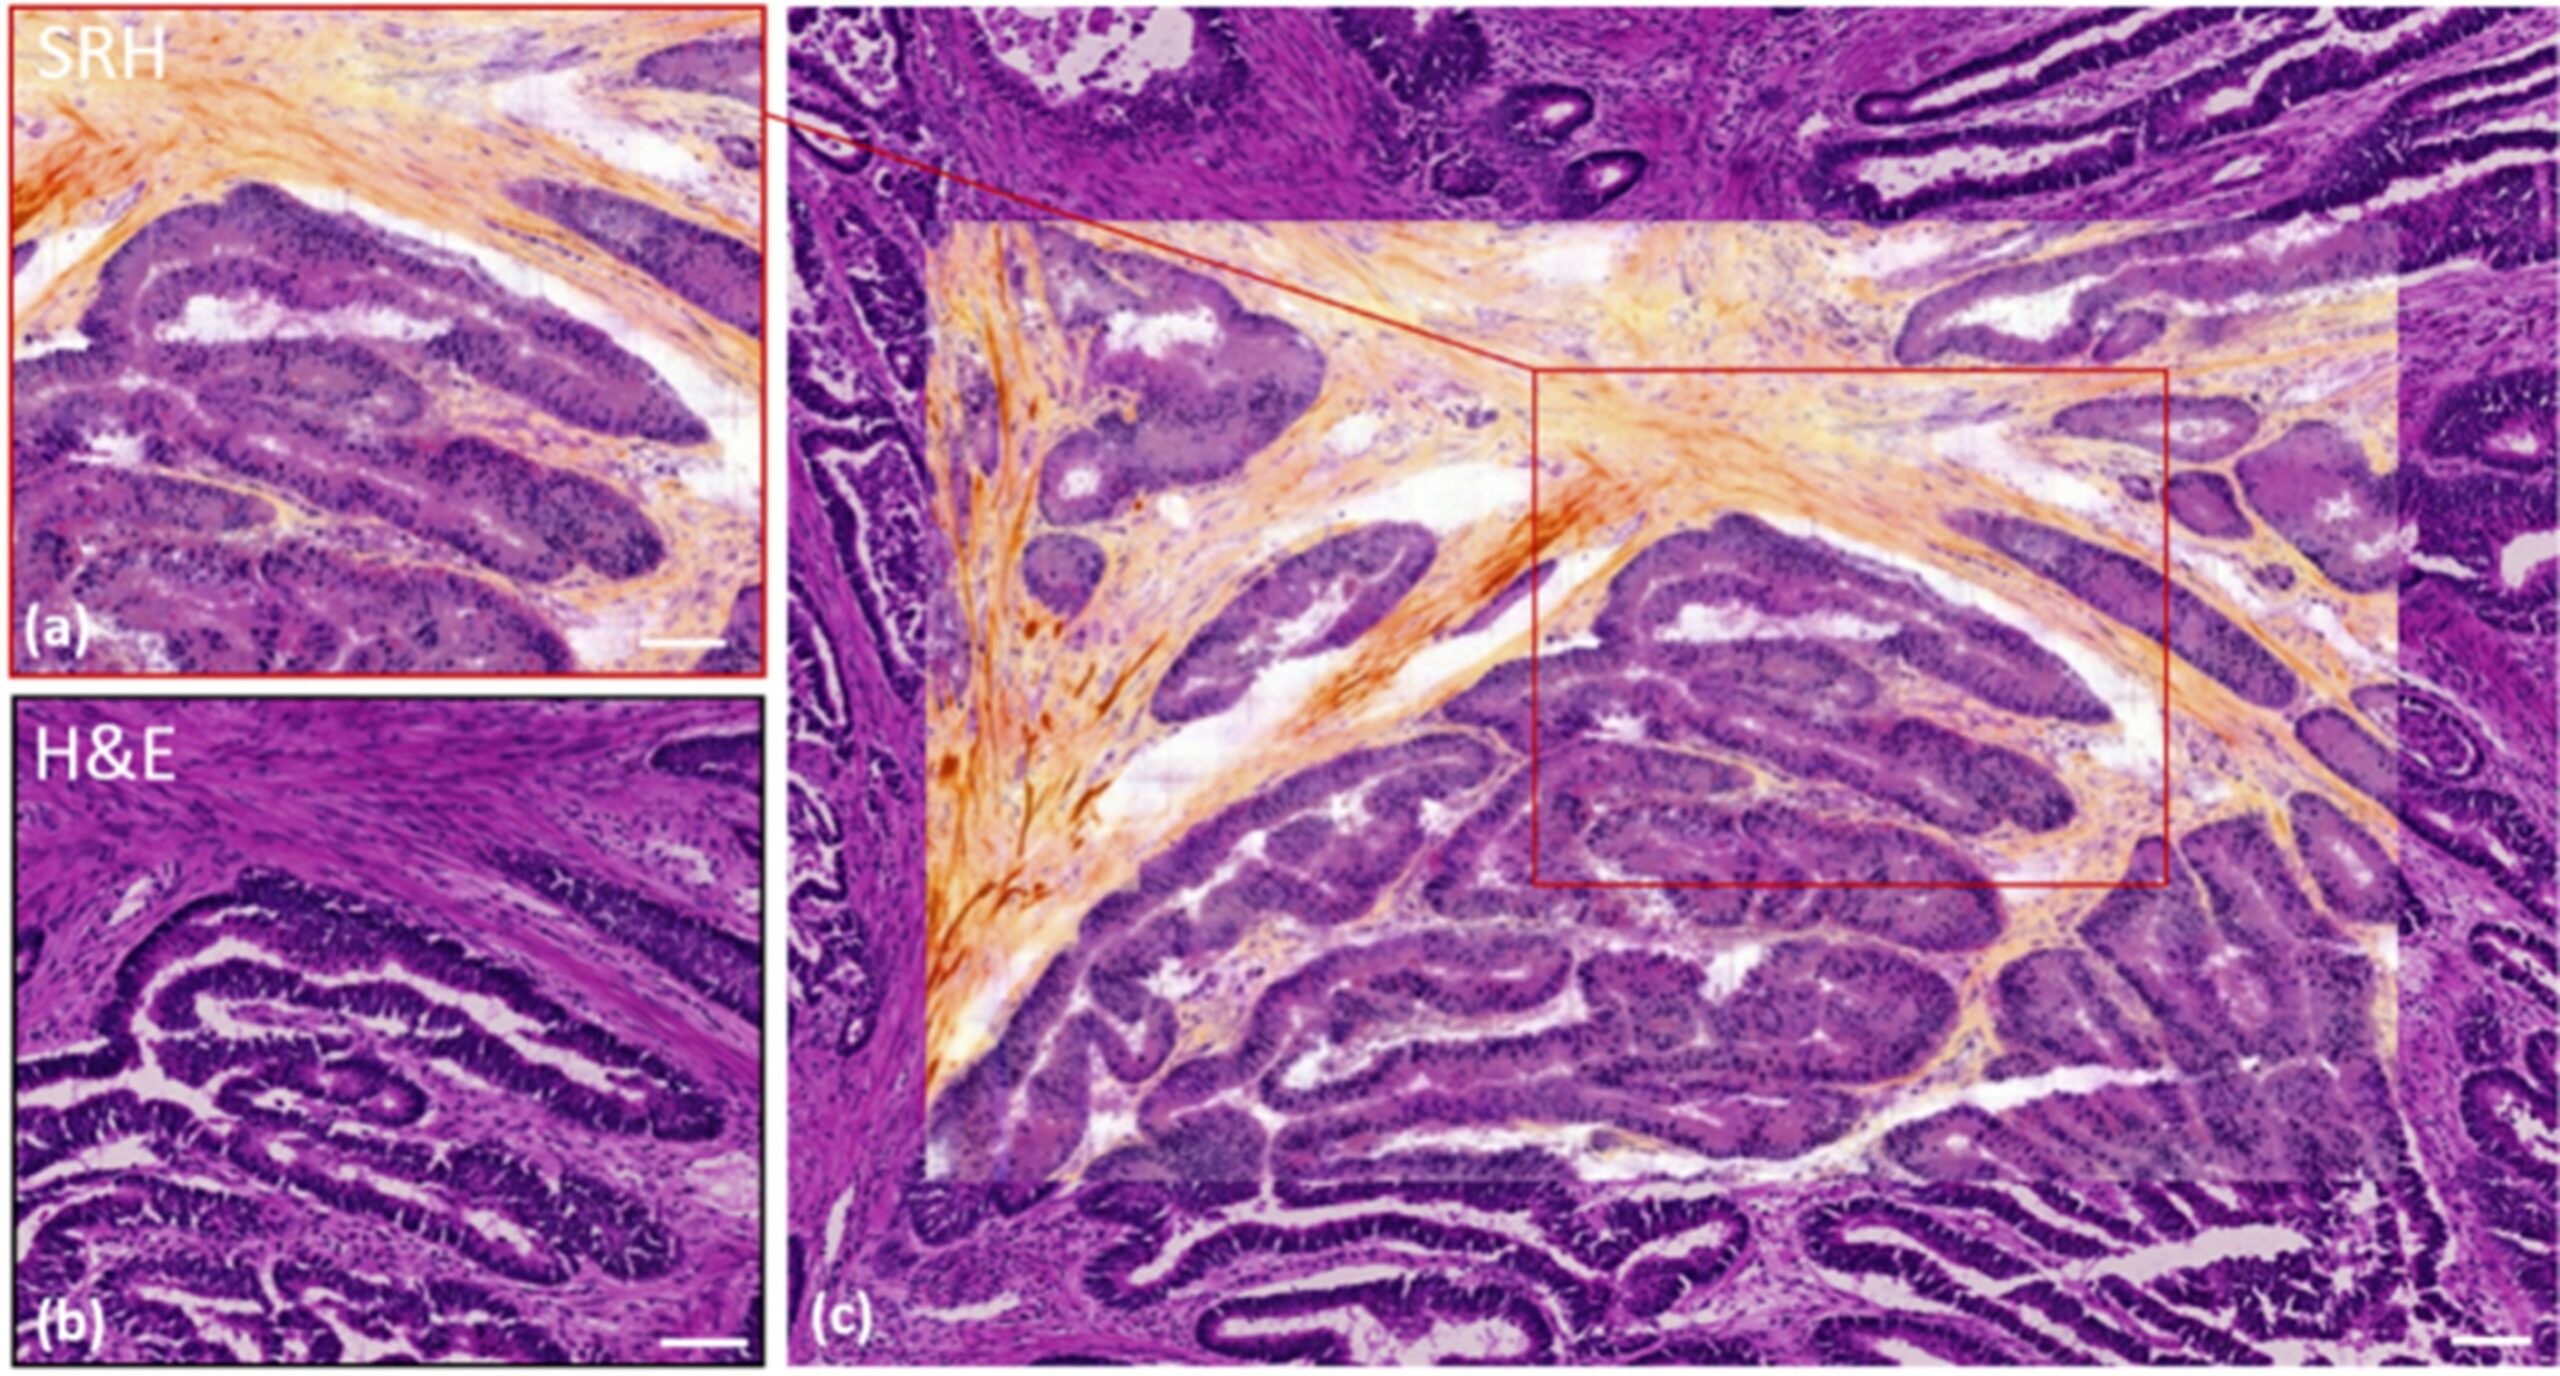
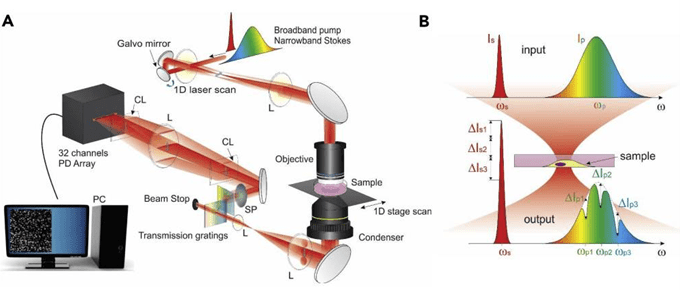
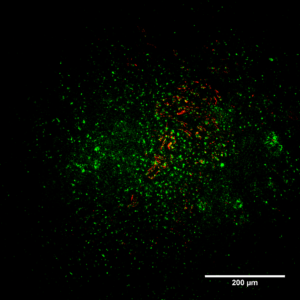
Furthermore, SRS is increasingly utilized in analysis of biological samples and has proven highly efficient in histology research. In histology, haematoxylin & eosin (H&E) staining has been a gold standard for decades owing to its robustness in cells and nuclei detection and allowing fast imaging and analysis in brightfield optical microscopy. However, a pitfall of H&E is the sample preparation. Despite the highly streamlined procedures today decreasing the preparation time of H&E samples to ~20-30 min, stimulated Raman histology (SRH) offers significantly faster alternative in terms of sample preparation while achieving the same tissue and cell segmentation data (figure 2) without any sample treatment, fixing or staining [4]. Moreover, in combination with deep learning methods SRH has been employed in brain tumour analysis with highly precise distinction rate of tumour and non-tumour tissues while using only two Raman shifts – 2850 cm-1 and 2950 cm-1 attributed to CH2 and CH3 molecular stretches, respectively. Due to the significantly shorter time period required for data extraction, SRH can be utilized in interoperational screening allowing the surgical team to quickly evaluate the tissue morphology and decide the direction of the procedure [5]. Moreover, CRS optical imaging can be enhanced by incorporating further optical modalities such as second harmonic generation (SHG). This is exploited for imaging of non-centrosymmetric structures, which in biological environment are typically collagen fibres and muscle fibres. Sarri et. al. lead a comparative study between the combined SRH and SHG with H&E staining of cryogenic biopsies of healthy and cancerous colon. Herein, Sarri simultaneously targets CH2 and CH3 stretches by coupling two optical parametric oscillators (OPOs) and a dual lock-in-amplifier and thus further increasing the acquisition speed [6]. More recently CRS technology co implemented with SHG and multi-photon modalities has been fitted into a compact, portable device which was successfully used in clinical imaging translation by obtaining non-invasive skin biopsies from patients suffering from psoriasis and atopic dermatitis [7]. In commercially available SRS systems, hyperspectral data is commonly acquired through continuous spectral tuning during which Stokes laser wavelength remains constant and pump laser wavelength is tuned. This process is time consuming and hence we envision that next-gen SRS optical systems will also exercise the application of multiplex SRS. In multiplex SRS, the tuneable narrowband pump laser is replaced by a broadband laser with a 32-channel lock-in-amplifier (figure 3) allowing virtually to scan through the CH region in one raster scan [8]. This speed would then almost revolutionize the capability of SRS in label-free live-cell imaging and in vivo.
In order to detect and track target molecules in biological environment, molecules of interest require chemical modifications through introduction of -C-D, -C≡C, and -C≡N moieties. These bonds vibrate at frequencies in “cell-silent” regions of the Raman spectrum and therefore can be detected at high contrast and potentially at low concentrations as there is no endogenous vibrational source within that spectral region. Ponatinib [9] and erlotinib [10], both anti-tumour drugs with an integrated alkyne bond in their structures were successfully detected with SRS in cell cultures after one hour of incubation. Entire cell components can be visualised, with SRS, through a combination of alkynes with (deoxy) ribonucleosides, amino acids, fatty acids [11]. The variety of individual Raman tags in a single cell sample exceeds the amount of fluorescent dyes significantly owing to relative narrow spectral bands intrinsic to nitrile and alkyne vibrations. Tuning the spectral resonance of Raman tags has been achieved through the introduction of changes in the chemical structure of the tag. By varying the amount of xanthene rings, substituting single atom with an alternative element and through isotope editing, Wei et. al. introduced a pallet of 20 polyyne dyes for Raman multimodal imaging [12]. Isotope editing can be further picked-up in different imaging techniques, such as PET (18F) and MRI (19F) imaging.
Using truly multimodal probes allows the analysis of the same sample with multiple imaging technologies, such as CRS, PET, MRI and mass spectrometry imaging enabling us to virtually zoom in from whole organisms to sub-cellular imaging and drug tracking with a single probe.
Section n. 2
Light sources for CARS microscopy
Written by Dominykas Gudavičius (ESR15)
In coherent anti-Stokes Raman scattering (CARS) microscopy two laser beams are used to produce radiation at a third wavelength when energy difference between pulses matches vibrational energy of a sample. For this vibrationally specific microscopy method it is critical to have a reliable wavelength-tunable light source to address different Raman bands. Optical parametric amplifiers (OPAs) and oscillators (OPOs) are well suited for this task; both cases will be introduced next.
One of the methods to implement CARS is raster-scanning. Currently, the majority of raster-scanning CARS setups rely on an OPO with multiple outputs. The biggest advantage of such a system is its compact one-box solution that allows a relatively simple overlap of beams in space and time. However, typical OPO output is a coupled signal-idler pair with a residual pump beam, limiting the Raman shift’s tunability. To solve the issue, a new generation of OPOs have emerged in the market with widely tunable and independent outputs. One of such system is CRONUS-2P (Light Conversion), with parameters presented in Table 1.
Table 1: Wavelength-tunable femtosecond laser CRONUS-2P parameters.
Output 1 | Output 2 | Output 3 | |
Tunability | 680 – 960 nm | Fixed at 1025 nm | 960 – 1300 nm |
Group delay dispersion (GDD) control | Implemented | – | Implemented |
Pulse duration | ~ 150 fs | ||
Pulse energy | ~ 13.5 nJ | ||
Repetition rate | 76 MHz | ||
Average power | ~ 1 W | ||
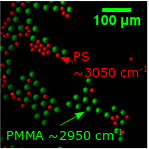
The femtosecond pulses come with a broad spectrum; thus, the spectral resolution might not be suitable for some CARS applications. However, a spectral focusing scheme could be implemented which greatly increases spectral resolution [13,14]. An image taken by using CRONUS-2P with the spectral focusing scheme is presented in Figure 4. By tuning Raman band to 3082 cm-1 and then shifting the pump beam in time by a delay line, one can sweep through resonant frequencies of different materials. In Figure 4, the test sample contains a mixture of polystyrene (PS) and polymethyl methacrylate (PMMA) microspheres with their frequencies at 3050 cm-1 and 3950 cm-1, respectively. Time required to take a single image was 10 seconds.
If raster scanning is not suitable due to a long scanning time, a wide-field approach could be taken. A wide-field CARS imaging offers a much faster image acquisition but requires a light source with a much greater pulse energy. One of the solutions is a laser coupled with an OPA. Parameters of the laser system used (from Light Conversion) are presented in Table 2. In addition to CARS, this configuration made it possible to perform second harmonic generation (SHG) imaging of human skin tissue sample. The combined image is presented in Figure 5. The imaged area of the sample spans roughly 750 µm and takes only 0.5 s.
| Output 1 (OPA) | Output 2 (Laser) | |
| Tunability | Signal range: 630 – 1030 nm Idler range: 1030 – 2600 nm | Fixed at 1030 nm |
| Average power | ~ 1.7 W at 800 nm | ~ 1 W |
| Pulse engergy | ~ 3.3 µJ | ~ 1.9 µJ |
| Pulse duration | ~ 150 fs | |
| Repetition rate | 515 kHz | |
Section n. 3
EMCCD and sCMOS cameras for scientific imaging
Written by Ediz Herkert (ESR8)
A comparison of the key figures of current camera models
The emergence of faster and more sensitive scientific cameras allows to acquire images with unprecedented sensitivity and speed. This is particularly important for applications in life sciences where techniques like Raman imaging require low-noise detectors while other techniques like fluorescent correlation spectroscopy rely on frame rates in the upper kilohertz range. To obtain meaningful data it is therefore essential to choose the scientific camera according to the experimental conditions.
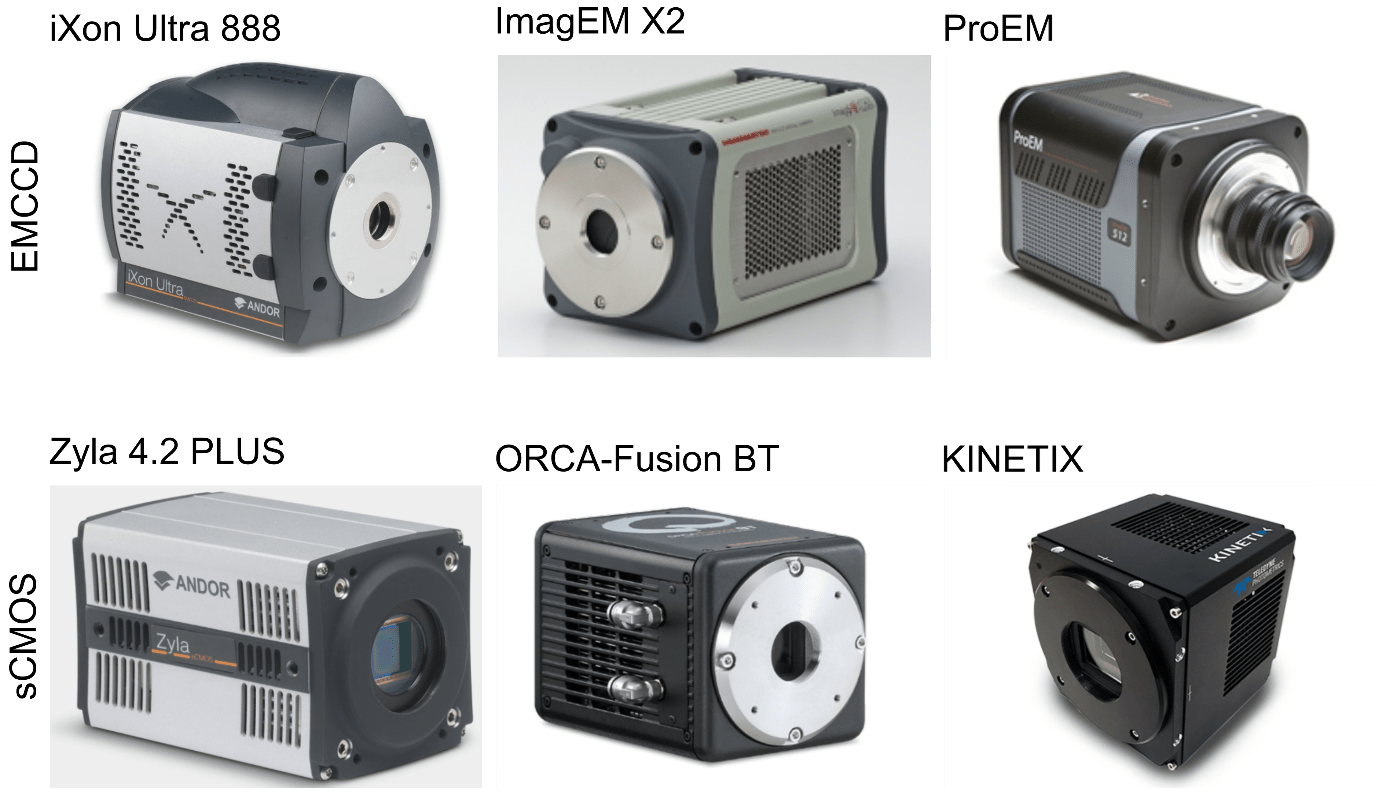
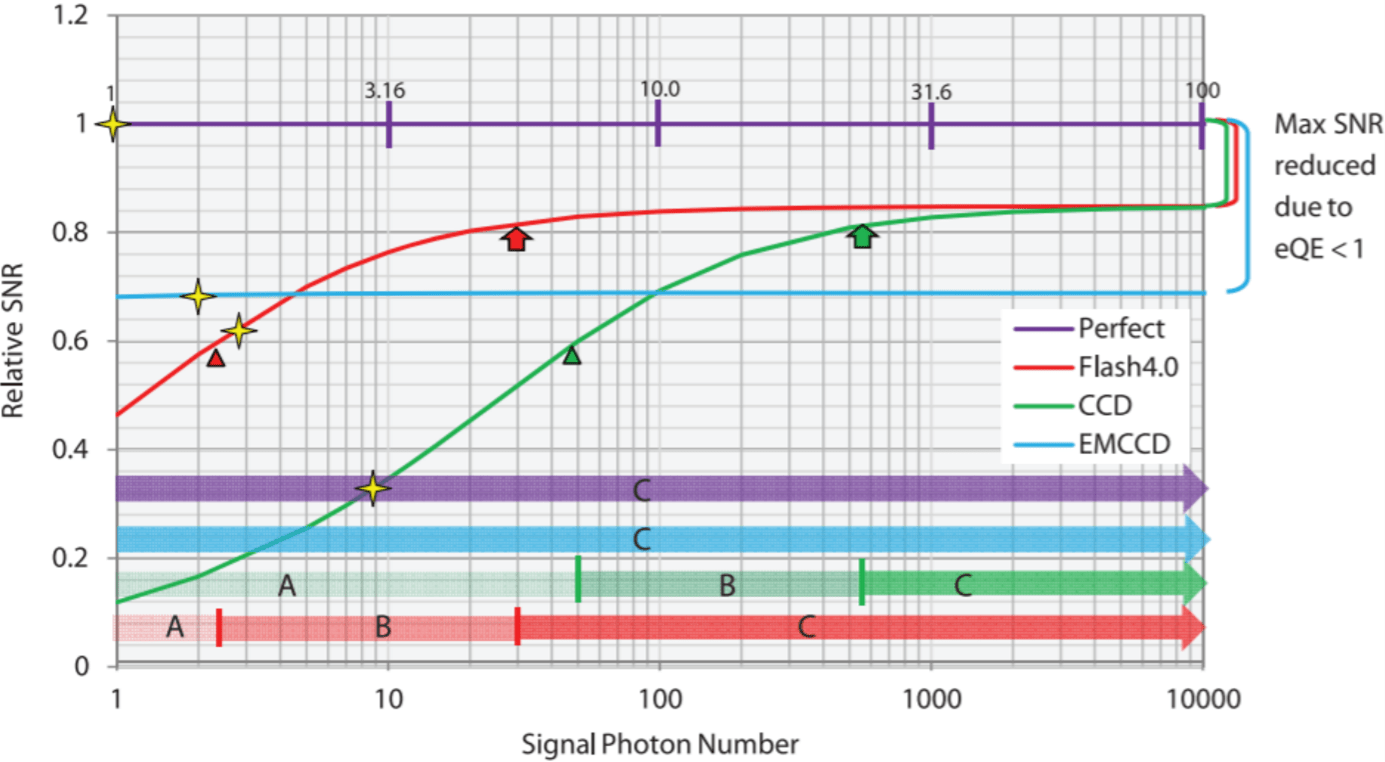
The three prevalent scientific camera technologies are charge-coupled device (CCD) cameras, electron-multiplying CCD (EMCCD) cameras, and scientific complementary metal-oxide-semiconductor (sCMOS) cameras. In this newsletter we focus on current EMCCD and sCMOS cameras as they mostly outperform traditional CCD cameras aside from long exposure applications [15] and as EMCCD cameras can be operated without multiplicaiton. The presented cameras are all optimized for operation in the optical regime between 300 – 1000 nm and are compared using the same key figures. These figures are the number of pixels, the pixel size, the maximum quantum efficiency, the full-frame frame rate, the highest sub-array frame rate, the full well capacity, the read noise at full read-out speed, the dark noise, and in the case of EMCCDs the gain. These key numbers allow to easily compare the latest camera systems regarding their speed, dynamic range [16,17], and signal to noise ratio (SNR)[18] for your particular experimental conditions. When comparing the numbers it is important however to keep in mind a few differences between sCMOS and EMCCD cameras. On the one hand, due to the pixel-wise charge-to-voltage conversion of sCMOS cameras the read noise is a statistical measure and specified as the root mean square (RMS). On the other hand, the multiplication process in EMCCD cameras effectively halves the quantum efficiency [19,20] and can reduce the dynamic range at high gains [17]
Table 3: Summary EMCCD cameras comparison
|
EMCCD |
iXon Ultra 888 |
ImagEM X2 |
ProEM |
|
Resolution |
1024×1024 px |
512×512 px |
1024×1024 px |
|
Pixel size |
13 µm |
16 µm |
10 µm |
|
Quantum efficiency |
> 95 % |
> 90 % |
> 95 % |
|
Frame rate (full-frame) |
26 fps |
70.4 fps |
30 fps |
|
Frame rate (sub-array) |
2053 (at 64×64 px) |
820 (16×16 px) |
4830 (32×30 px) |
|
Full well capacity |
80,000 e- |
370,000 e- |
150,000 e- |
|
Read noise |
< 1 e- |
< 1 e- |
< 1 e- |
|
Dark noise |
0.00011 e-/px/s |
0.0005 e-/px/s |
0.002 e-/px/s |
|
Gain |
1000 |
1200 |
1000 |
The iXon Ultra 888 from Oxford Instruments [21] provides single photon counting due to a quantum efficiency above 95%, very low dark noise of 0.00011 e- per pixel and second, and a read noise below 1 e- at the maximum gain of 1000. The low noise level and high quantum efficiency also allow to reduce the used laser powers and therefore phototoxicity being particularly important for life cell experiments. At the full resolution of 1024×1024 pixels the iXon Ultra 888 provides 26 fps and up to 2053 fps when reading only 64×64 of the 13µmx13µm sized pixels. Compared to the other EMCCD cameras it provides a relatively low full well capacity of only 80,000 e- potentially limiting the dynamic range.
With 370,000 e- the ImagEM X2 from Hamamatsu [22] offers a significantly higher full well capacity and a higher dynamic range. The EMCCD camera from Hamamatsu can read out the full 512×512 pixels at 70.4 fps which is slower than the 93 fps that can be reached at 512×512 pixels with the iXon Ultra 888. Also in the sub-array mode the model from Hamamatsu reads out 16×16 of the 16µmx16µm sized pixels at a lower speed of 820 fps. With a read noise of below 1e-, a slightly higher dark noise of 0.0005 e- per pixel and second, and a slightly higher maximum gain of 1200 the SNR of the ImagEM X2 can be expected to be comparable to the iXon Ultra 888 for many experimental conditions. Therefore, the key advantage of the ImagEM X2 is the high dynamic range originating from the very high full well capacity. However, as pointed out before this advantage can be lost at high gain factors.
The ProEM camera from Princeton Instruments [23] positions itself between the two previous EMCCD cameras with a full well capacity of 150,000 e-. Like the other cameras it offers a read noise of below 1e- at the maximum electron-multiplying gain of 1000 and a maximal quantum efficiency above 95%. However, with a pixel area of 10µm x 10µm and a dark noise of 0.002 e- per second and pixel it provides the smallest pixels and highest dark noise out of the three EMCCD cameras. While the full-frame of 1024×1024 pixels is read out at 30 fps it is the fastest of the EMCCD cameras in the 32×30 sub-array mode capturing 4830 fps pixels. Due to the higher dark noise but comparably high read out speed the ProEM camera is particularly suited for observing transient events with high sensitivity.
Table 4: Summary sCMOS cameras comparison
sCMOS | Zyla 4.2 PLUS | ORCA-Fusion BT | KINETIX |
Resolution | 2048×2048 px | 2304×2304 px | 3200×3200 px |
Pixel size | 6.5 µm | 6.5 µm | 6.5 µm |
Quantum efficiency | 82 % | 95 % | 95 % |
Frame rate (full-frame) | 101 | 89 | 498 |
Frame rate (sub-array) | 26,041 fps (1024×8 px) | 41,000 fps (2304×4 px) | 60,000 fps (3200×16 px) |
Full well capacity | 30,000 e- | 15,000 e- | 15,000 e- |
Read noise | 1.3 e- (rms) | 1.6 e- (rms) | 2 e- (median) |
Dark noise | 0.019 e-/px/s | 0.7 e-/px/s | 1.03 e-/px/s |
With 101 fps the Zyla 4.2 PLUS from Oxford Instruments [24] offers the fastest full-frame frame rate. The frame rate can be increased up to 26,041 fps when reading only 1024×8 of the 2048×2048 pixels and is thus ideally suited for highly transient measurements like fluorescence correlation spectroscopy (FCS). With a pixel size of only 6.5µm x 6.5µm it offers a relatively small area which is however comparable to similar high-speed sCMOS cameras. A good quantum efficiency of 82%, dark noise of only 0.019 e- per pixel and second, low read noise of 1.3e-, and full well capacity of 30,000 make it furthermore a good candidate when low noise and a high dynamic range are required.
With the ORCA-Fusion BT from Hamamatsu [25] and the KINETIX from Photometrics [26] two very similar ultrafast sCMOS cameras were recently introduced. Both cameras are based on 6.5µm x 6.5µm sized pixels, have a quantum efficiency of around 95%, and a full well capacity of 15,000 e-. The KINETIX has speed advantages and offers 498 fps at full frame (3200×3200 pixels) read-out and up to 60,000 fps at 3200×16 pixels. In contrast to that, the ORCA-Fusion BT can read out it’s 2304×2304 pixels at 89 fps and goes up to 41,000 fps at 2304×4 pixels. While the ORCA-Fusion BT is slower than the KINETIX it is better in terms of noise providing 1.6e- read noise and 0.7e- per pixel and second dark noise. The KINETIX offers a median read noise of 2e- (RMS not specified) and 1.03e- per pixel and second dark noise. With these specifications both cameras enter unprecedented temporal scales at good noise levels and therefore pave the way towards experiments that require microsecond temporal resolution with the typical advantages of sCMOS cameras like super-resolution FCS. Which of the two cameras is more suitable for an experiment is mostly a question of whether a lower noise or the absolute highest frame rate is required.
The recent development of EMCCD and sCMOS based cameras allows the detection of photons will less noise, higher sensitivity, and higher speed. While EMCCD cameras are still the best choice at the absolute lowest signal levels as in Raman spectroscopy the rapid progress of the sCMOS technology can replace it for most other application and particularly when high speed read out is required as for FCS applications. Since the latest qCMOS technology from Hamamatsu [27] has an extremely low read noise of only 0.27e- it provides photon number resolving capabilities. Therefore, sCMOS cameras could soon replace the EMCCD technology also in the single-digit photon regime. However, more studies are required confirming that this is indeed the case for experiments in biophotonics.
About the Authors
The MUSIQ Innovation Newletter n. 3 was written by three of the Early Stage Researchers (ESRs) working on individual projects as part of the MUSIQ project.

Jan Majer (ESR13)
Jan is hosted at GlaxoSmithKline in the UK. In his research project he is exploring the potential combination of Optical and Mass Spectrometry Imaging techniques to characterise endogenous and xenobiotic components at sub-cellular resolution His research there focuses in Ultrafast coherent spectroscopy of natural light-harvesting systems.

Dominykas Gudavičius (ESR15)
Dominykas is working at Light Conversion, Department of Research and Development in Lithuania. His individual research project within MUSIQ focuses on the development of femtosecond laser source for coherent nonlinear microscopy.

Ediz Herkert (ESR8)
Ediz is hosted at the Institute of Photonic Science in the department of Single Molecule Biophotonics in Spain. In his project he is researching Plasmonic antenna platforms for monitoring membrane receptor interactions in living cells at the nanoscale.
References
[1] Waring, M. J.; Arrowsmith, J.; Leach, A. R.; Leeson, P. D.; Mandrell, S.; Owen, R. M.; Pairaudeau, G.; Pennie, W. D.; Pickett, S. D.; Wang, J.; Wallace, O.; Weir, A., An analysis of the attrition of drug candidates from four major pharmaceutical companies. Nature Reviews Drug Discovery 2015, 14 (7), 475-486.
[2] Pammolli, F.; Righetto, L.; Abrignani, S.; Pani, L.; Pelicci, P. G.; Rabosio, E., The endless frontier? The recent increase of R&D productivity in pharmaceuticals. Journal of Translational Medicine 2020, 18 (1), 162.
[3] Sarri, B.; Canonge, R.; Audier, X.; Lavastre, V.; Pénarier, G.; Alie, J.; Rigneault, H., Discriminating polymorph distributions in pharmaceutical tablets using stimulated Raman scattering microscopy. 2019, 50 (12), 1896-1904.
[4] Lee, M.; Herrington, C. S.; Ravindra, M.; Sepp, K.; Davies, A.; Hulme, A. N.; Brunton, V. G., Recent advances in the use of stimulated Raman scattering in histopathology. Analyst 2021, 146 (3), 789-802.
[5] Hollon, T. C.; Pandian, B.; Adapa, A. R.; Urias, E.; Save, A. V.; Khalsa, S. S. S.; Eichberg, D. G.; D’Amico, R. S.; Farooq, Z. U.; Lewis, S.; Petridis, P. D.; Marie, T.; Shah, A. H.; Garton, H. J. L.; Maher, C. O.; Heth, J. A.; McKean, E. L.; Sullivan, S. E.; Hervey-Jumper, S. L.; Patil, P. G.; Thompson, B. G.; Sagher, O.; McKhann, G. M.; Komotar, R. J.; Ivan, M. E.; Snuderl, M.; Otten, M. L.; Johnson, T. D.; Sisti, M. B.; Bruce, J. N.; Muraszko, K. M.; Trautman, J.; Freudiger, C. W.; Canoll, P.; Lee, H.; Camelo-Piragua, S.; Orringer, D. A., Near real-time intraoperative brain tumor diagnosis using stimulated Raman histology and deep neural networks. Nature Medicine 2020, 26 (1), 52-58.
[6] Sarri, B.; Poizat, F.; Heuke, S.; Wojak, J.; Franchi, F.; Caillol, F.; Giovannini, M.; Rigneault, H., Stimulated Raman histology: one to one comparison with standard hematoxylin and eosin staining. Biomedical optics express 2019, 10 (10), 5378-5384.
[7] König, K.; Breunig, H. G.; Batista, A.; Schindele, A.; Zieger, M.; Kaatz, M., Translation of two-photon microscopy to the clinic: multimodal multiphoton CARS tomography of <i>in vivo</i> human skin. 2020, 25 %J Journal of Biomedical Optics (1), 014515.
[8] Huang, K.-C.; Li, J.; Zhang, C.; Tan, Y.; Cheng, J.-X., Multiplex Stimulated Raman Scattering Imaging Cytometry Reveals Lipid-Rich Protrusions in Cancer Cells under Stress Condition. iScience 2020, 23 (3), 100953-100953.
[9] Sepp, K.; Lee, M.; Bluntzer, M. T. J.; Helgason, G. V.; Hulme, A. N.; Brunton, V. G., Utilizing Stimulated Raman Scattering Microscopy To Study Intracellular Distribution of Label-Free Ponatinib in Live Cells. Journal of Medicinal Chemistry 2020, 63 (5), 2028-2034.
[10] El-Mashtoly, S. F.; Petersen, D.; Yosef, H. K.; Mosig, A.; Reinacher-Schick, A.; Kötting, C.; Gerwert, K., Label-free imaging of drug distribution and metabolism in colon cancer cells by Raman microscopy. Analyst 2014, 139 (5), 1155-61.
[11] Wei, L.; Hu, F.; Shen, Y.; Chen, Z.; Yu, Y.; Lin, C.-C.; Wang, M. C.; Min, W., Live-cell imaging of alkyne-tagged small biomolecules by stimulated Raman scattering. Nature Methods 2014, 11 (4), 410-412.
[12] Wei, L.; Chen, Z.; Shi, L.; Long, R.; Anzalone, A. V.; Zhang, L.; Hu, F.; Yuste, R.; Cornish, V. W.; Min, W., Super-multiplex vibrational imaging. Nature 2017, 544 (7651), 465-470.
[13] Hellerer, T., Enejder, A. M. K., & Zumbusch, A. (2004). Spectral focusing: High spectral resolution spectroscopy with broad-bandwidth laser pulses. Applied Physics Letters, 85(1), 25–27. https://doi.org/10.1063/1.1768312
[14] Rocha-Mendoza, I., Langbein, W., & Borri, P. (2008). Coherent anti-Stokes Raman microspectroscopy using spectral focusing with glass dispersion. Applied Physics Letters, 93(20), 3–6. https://doi.org/10.1063/1.3028346
[15] Hamamatsu, accessed 9 July 2021, https://camera.hamamatsu.com/jp/en/technical_guides/which_camera/index.html
[16] Photometrics, accessed 9 July 2021, https://www.photometrics.com/learn/imaging-topics/dynamic-range
[17] Oxford Instruments, accessed 9 July 2021, https://andor.oxinst.com/learning/view/article/dynamic-range-emccds
[18] Hamamatsu 2012, accessed 9 July 2021, https://www.hamamatsu.com/resources/pdf/sys/e_flash4_whitepaper.pdf?_ga=2.20183280.993334350.1625654675-1225487746.1620920188
[19] Hamamatsu, accessed 9 July 2021, https://camera.hamamatsu.com/jp/en/technical_guides/dissecting_camera/dissecting_camera05/index.html
[20] Khaoua et al., Sci. Rep., 11, 3530 (2021), https://doi.org/10.1038/s41598-021-82611-8
[21] Oxford Instruments, accessed 9 July 2021, https://andor.oxinst.com/products/ixon-emccd-cameras-for-life-science
[22] Hamamatsu, accessed 9 July 2021, https://www.hamamatsu.com/eu/en/product/type/C9100-23B/index.html
[23] Princeton Instruments, accessed 9 July 2021, https://www.princetoninstruments.com/products/proem-family/pro-em
[24] Oxford Instruments, accessed 9 July 2021, https://andor.oxinst.com/products/scmos-camera-series/zyla-4-2-scmos
[25] Hamamatsu, accessed 9 July 2021, https://www.hamamatsu.com/eu/en/product/type/C15440-20UP/index.html
[26] Photometrics, accessed 9 July 2021, https://www.photometrics.com/products/kinetix-family/kinetix#resource-downloads
[27] Hamamatsu 2021, accessed 9 July 2021, https://www.hamamatsu.com/resources/pdf/sys/SCAS0152E_ORCA-Quest_concept_brochure.pdf